


Tech Stocks Slammed in Volatile Election Week; Bonds Gain
Good morning,
In the week of the midterm elections when Democrats convincingly swept the House and Senate, stocks became extremely volatile. On the day after the election, stocks rallied, and were met the next day with the worst selloff since the onset of COVID in March 2020. The election also showed a general public’s disdain for data centers, as several electorates voted for a moratorium on their construction. See below for additional commentary:
- The Dow (-0.9%), NASDAQ (-3.4%), S&P 500 (-2.7%), and EAFE (-1.8%) were all down for the week.
- Taxable bonds gained 0.4% and tax-free municipal bonds gained 0.9%. The 10-year Treasury yield fell 0.05% to finish the week at 4.86%.
- Crude oil prices fell over $13 to finish the week at $90.83, down about 13%, causing energy stocks to fall about 12%.
- Technology stocks fell almost 7%, yet many of the mega AI companies (Apple, Google, Amazon, Meta, and Microsoft) performed well, because investors interpreted that those companies would slow down their capital spending on data center projects.
In economic news:
- The midterm elections resulted in Democrats gaining control of Congress effective January 2027. The stock markets tend to react more favorably with a divided government, and have a history of performing very well from November 1 through May 1 following the midterm elections.
- The US economy added 165,000 jobs in October, well above the analysts’ expectations, and the prior two months were revised upward. This demonstrates a strong labor market.
- The Institute of Supply Managers (ISM) Manufacturing and Services Indexes were reported and both remain in “positive” territory, depicting an expanding economy.
- Key inflation data – Consumer Price Index (CPI) and Producer Price Index (PPI – will be reported this week.
- The drop in oil prices and 10-year Treasury yields could have a favorable impact on gasoline prices and mortgage rates, as both have fallen since the beginning of last week.
Chart of the Day:
The chart below shows the NASDAQ 100 over the past four years, and that it has experienced seven corrections (drops of 10%) during that period, yet also demonstrates that the trend continues to remain upward. In summary, volatility will always exist in the market, and it shouldn’t trigger a fearful reaction.
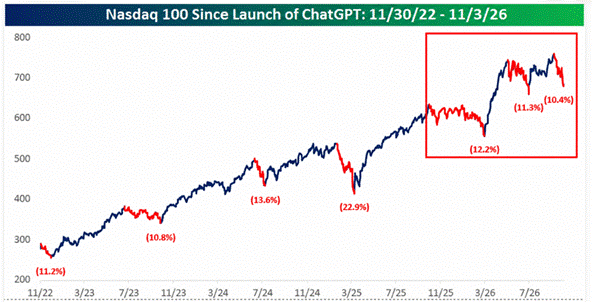
Source: Cornerstone Portfolio Research
Have a great day and terrific week!

Content in this material is for general information only and not intended to provide specific advice or recommendations for any individual. All performance referenced is historical and is no guarantee of future results. All indices are unmanaged and may not be invested into directly.
The economic forecasts set forth in this material may not develop as predicted and there can be no guarantee that strategies promoted will be successful.
The Standard & Poor’s 500 Index (S&P500) is a capitalization-weighted index of 500 stocks designed to measure performance of the broad domestic economy through changes in the aggregate market value of 500 stocks representing all major industries. The NASDAQ Composite Index measures all NASDAQ domestic and non-U.S. based common stocks listed on The NASDAQ Stock Market. The market value, the last sale price multiplied by total shares outstanding, is calculated throughout the trading day, and is related to the total value of the Index. Government bonds and Treasury bills are guaranteed by the US government as to the timely payment of principal and interest and, if held to maturity, offer a fixed rate of return and fixed principal value.

