
Stocks Fall Despite Strong Economic Data; Bonds Exhibit Sharp Gains
Good morning,
The Dow (-1.2%), NASDAQ (-2.1%), and S&P 500 (-1.4%) all dropped last week. Conversely, taxable bonds gained 0.9% and tax-free municipal bonds gained 0.3%. The 10-year Treasury yield fell 0.15% to finish the week at 4.05%.
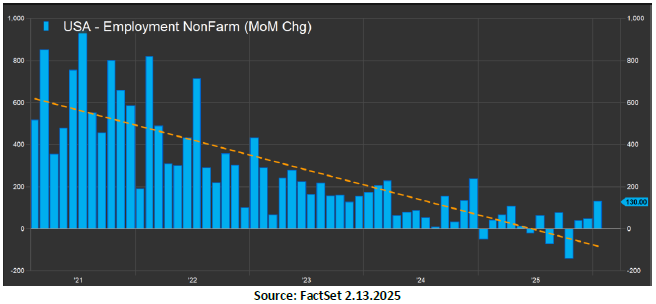
Stocks moved lower on the week as investors seemed to move away from the Magnificent 7 AI stocks and punishing those companies that could be damaged by the use of AI, such as software companies. Over the past few weeks, we have seen a move toward the rest of the market, which is healthier than just 7 stocks driving nearly all the market returns like we saw in 2023 and 2024. In economic news, January inflation and jobs reports led the way, and the results were quite interesting. The Consumer Price Index (CPI) rose 2.4% in January, down from 2.7% in December and lower than the 2.5% expected. Also, the US economy added 130,000 jobs, far more than the 55,000 expected. Lower inflation can give way for the Fed to lower interest rates, and the bond market is pricing in three rate cuts in 2026 – June, September, and December.
The jobs report takes on a life of its own, as the unemployment rate has fallen two months in a row and is down to 4.3%. However, jobs growth has steadily declined for several years and takes on historical importance. We have never seen this many negative jobs reports before, during, or even after a recession. Plus, we have never really seen a rise in unemployment followed by a reversal without having gone through a recession unfolding. According to Manulife / John Hancock Investments, the chart below could be the start of a turn in the jobs market.
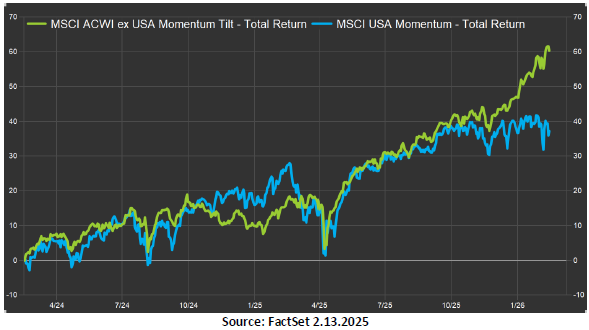
On a separate note, international stocks have also performed extraordinarily well, particularly when compared to US stocks. That said, international stocks have become increasingly undervalued relative to US stocks and have only outperformed US stocks twice in the last 10 years (2017 and 2025), and in 2017, it only outgained the US by 3% (38% vs. 35%). The chart below shows US vs. international stock markets over the past 2 years. Note that this does not suggest running out to buy international stocks, but serves as a fresh reminder of the importance of portfolio diversification.
Have a great day and terrific week!

Source: Yahoo Finance
Content in this material is for general information only and not intended to provide specific advice or recommendations for any individual. All performance referenced is historical and is no guarantee of future results. All indices are unmanaged and may not be invested into directly.
The economic forecasts set forth in this material may not develop as predicted and there can be no guarantee that strategies promoted will be successful.
The Standard & Poor’s 500 Index (S&P500) is a capitalization-weighted index of 500 stocks designed to measure performance of the broad domestic economy through changes in the aggregate market value of 500 stocks representing all major industries. The NASDAQ Composite Index measures all NASDAQ domestic and non-U.S. based common stocks listed on The NASDAQ Stock Market. The market value, the last sale price multiplied by total shares outstanding, is calculated throughout the trading day, and is related to the total value of the Index. Government bonds and Treasury bills are guaranteed by the US government as to the timely payment of principal and interest and, if held to maturity, offer a fixed rate of return and fixed principal value.
