


Markets Choppy But Lower on Economic Data; Bonds Mixed
Good morning,
The Dow (-1.3%), NASDAQ (+0.5%), S&P 500 (-0.3%), and EAFE (-1.5%) were mixed for the week. Similarly, bonds were also mixed as taxable bonds fell 0.6% and tax-free municipal bonds gained 0.5%. The 10-year Treasury yield rose 0.12% to finish the week at 5.28%.
- The markets continue to be driven by interest rates, inflation fears, oil prices, and the labor market.
- The Fed-favored inflation gauge – Personal Consumption Expenditures (PCE) - rose 3.4%, less than the 3.7% expected. Core inflation of 3.0% was also lower than economists’ expectations.
- The US economy added 27,000 jobs in September, lower than the 84,000 jobs expected. The prior two months were also revised downward. In a separate (but contrary) report, the unemployment rate rose to 4.2%, slightly higher than expected, but still remaining at historic lows.
- Oil prices fell for the week, as optimism grew that the Strait of Hormuz will be re-opened fully.
- The combination of a weaker jobs report and lower inflation than expected caused markets to rally late in the week and erase many of the losses incurred. This is because investors viewed this data as optimistic that the Fed won’t raise interest rates at its next meeting later this month.
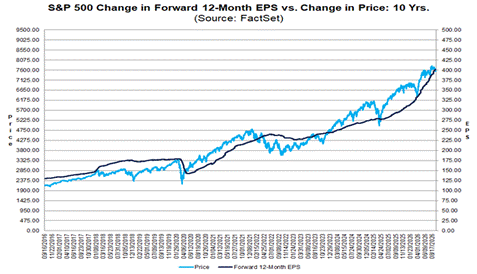
- Corporate earnings season will soon be starting, and the fundamental price of a stock is based on its earnings and earnings growth. The chart below illustrates that point, as the earnings expectations and market value have run amazingly parallel to each other over the past ten years. The latest estimate is that corporate earnings will increase by a remarkable 29% over the same quarter last year. That is very encouraging!
Have a great day and terrific week!

Source: Yahoo Finance
Content in this material is for general information only and not intended to provide specific advice or recommendations for any individual. All performance referenced is historical and is no guarantee of future results. All indices are unmanaged and may not be invested into directly.
The economic forecasts set forth in this material may not develop as predicted and there can be no guarantee that strategies promoted will be successful.
The Standard & Poor’s 500 Index (S&P500) is a capitalization-weighted index of 500 stocks designed to measure performance of the broad domestic economy through changes in the aggregate market value of 500 stocks representing all major industries. The NASDAQ Composite Index measures all NASDAQ domestic and non-U.S. based common stocks listed on The NASDAQ Stock Market. The market value, the last sale price multiplied by total shares outstanding, is calculated throughout the trading day, and is related to the total value of the Index. Government bonds and Treasury bills are guaranteed by the US government as to the timely payment of principal and interest and, if held to maturity, offer a fixed rate of return and fixed principal value.

